

 English
 Lietuvių
 Latviešu
 Eesti
Eesti Русский
 Polski
 Українська
 Deutsch
 Italiano
 Español
 Français
 Português
 Čeština
 Magyar
 Română
 Ελληνικά
 Türkçe
 日本語
日本語 العربية
 हिन्दी
 Bahasa Indonesia
 Bahasa Melayu
 ไทย
ไทย Tiếng Việt
 বাংলা
বাংলাGoogle Analytics 4 Reports for Small Business: What to Check Weekly
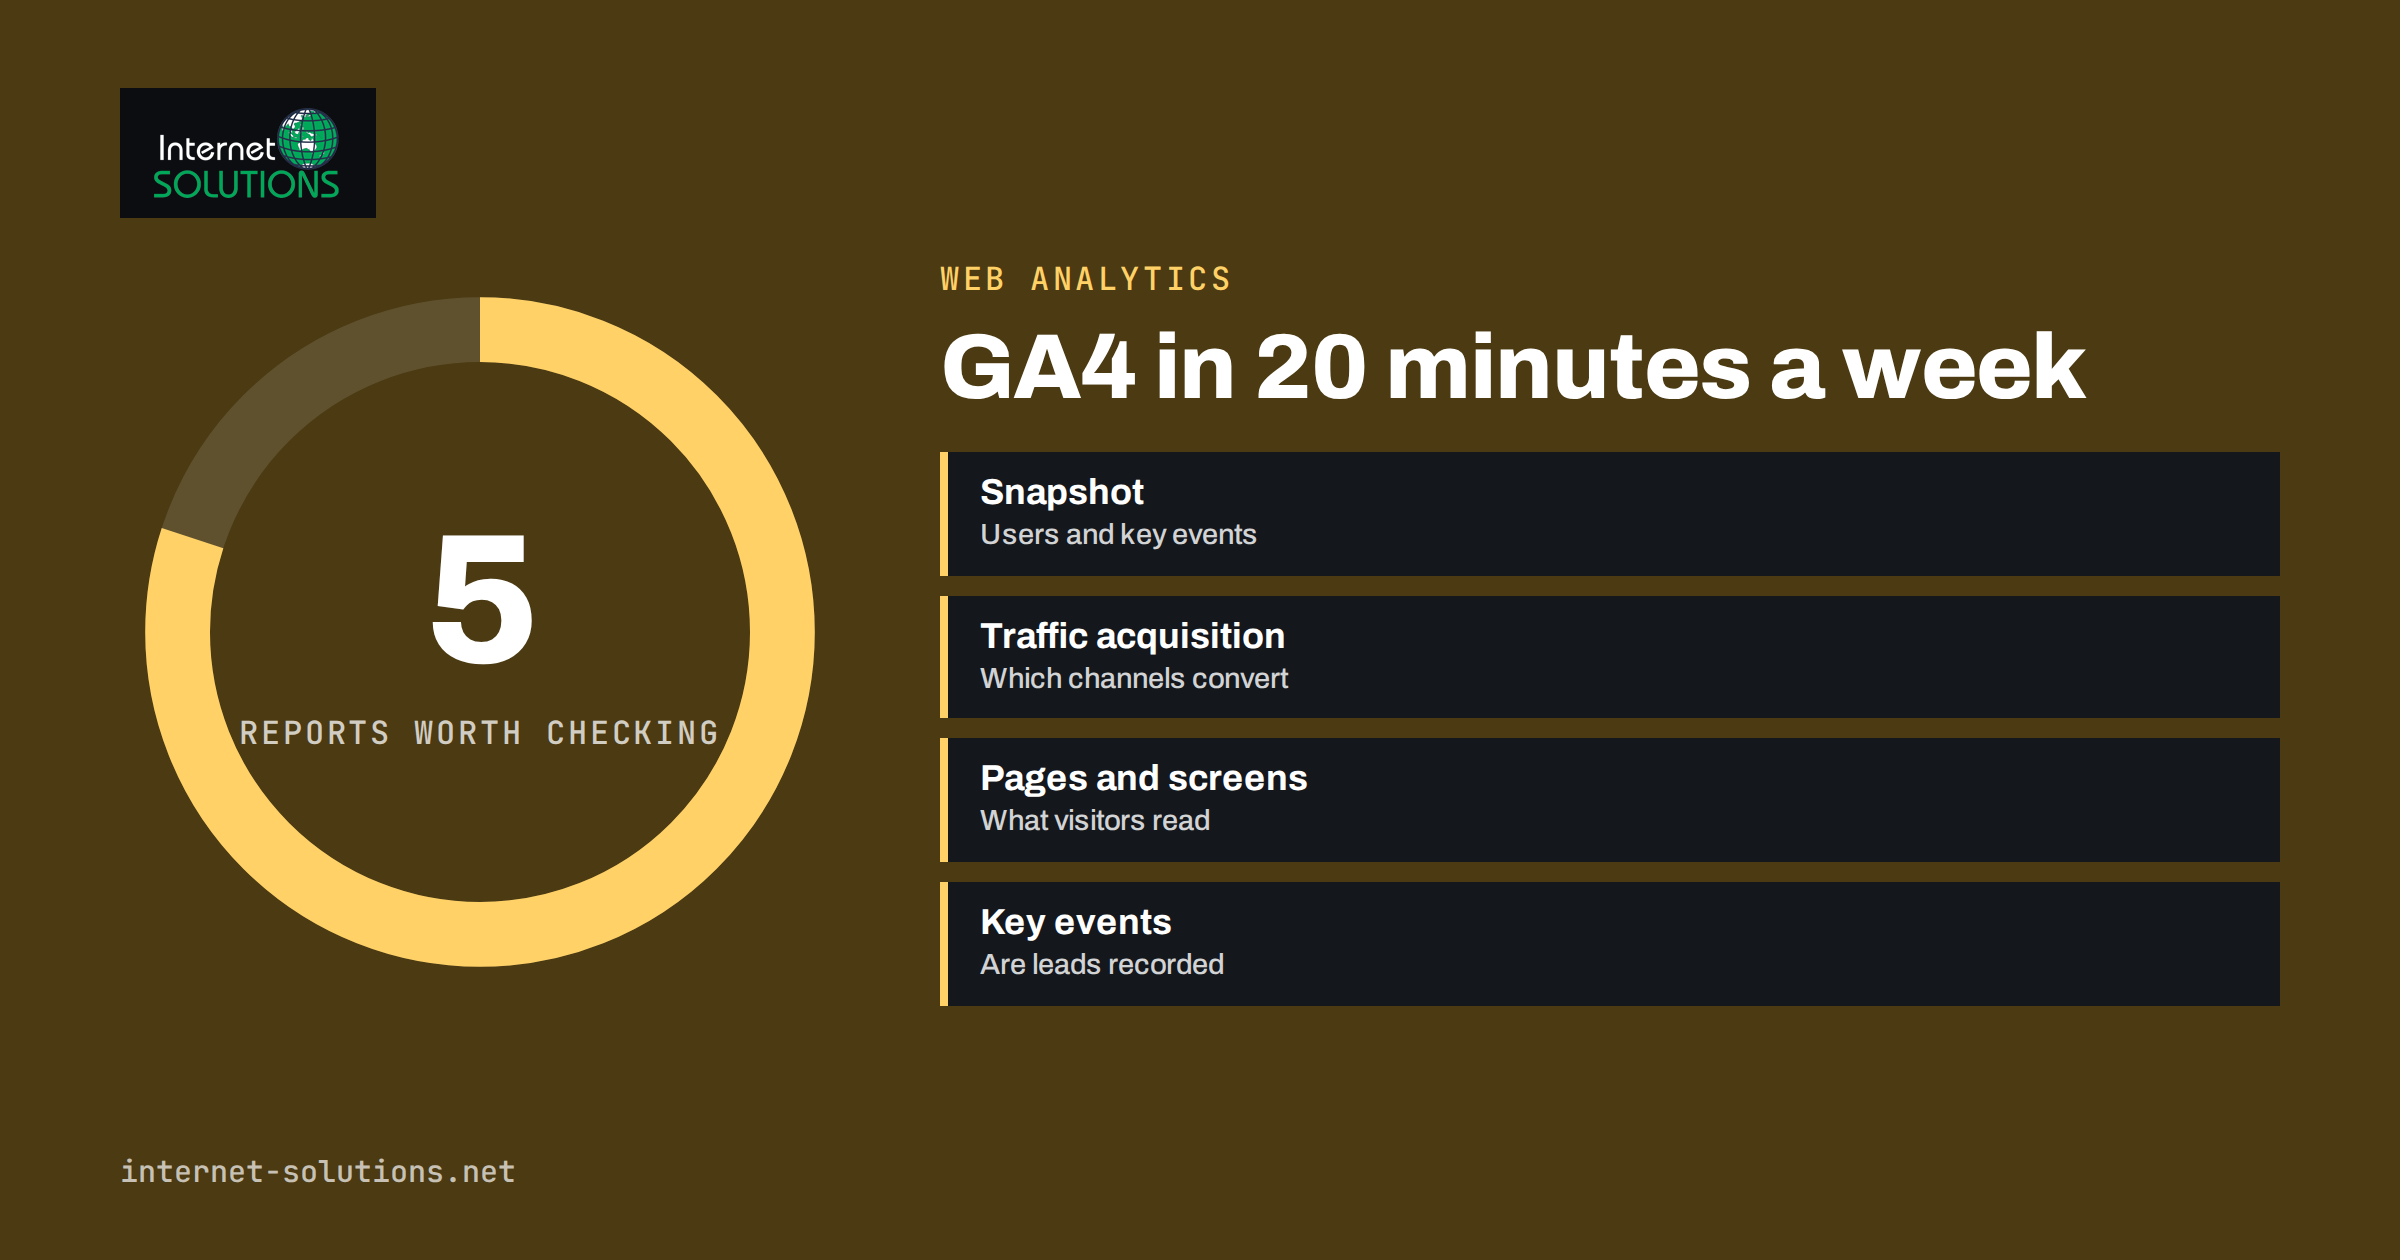
Google Analytics 4 reports can answer most of the questions a small business has about its website, but only if you know where to look. The interface offers dozens of reports, dimensions and settings, and many owners open it, see a wall of numbers and close it again. The solution is not to learn every report. It is to pick a small set, check it on a schedule and ask the same practical questions each time: where did visitors come from, what did they do, and did that lead to enquiries or sales?
This guide describes the reports worth a weekly look, the figures to read in each, a simple routine that takes about twenty minutes, and the mistakes that make GA4 data misleading. It assumes tracking is already in place. If it is not, start with our guide to conversion tracking with GA4, Google Tag Manager and the Meta Pixel.
How GA4 Organizes Data
GA4 is built around events. Everything a visitor does, such as loading a page, scrolling, clicking a link or submitting a form, is recorded as an event with parameters. Reports then group these events by dimensions, which are descriptive attributes like source, page or country, and show metrics, which are numbers like users, sessions and key events.
A few terms appear throughout.
- Users are the people (or, more exactly, browsers or devices) that visited. Active users are those who had an engaged session.
- Sessions are visits. One user can have several sessions.
- Engaged sessions are sessions that lasted longer than ten seconds, had a key event or had at least two page or screen views. The share of engaged sessions is the engagement rate, which replaces the old bounce rate as the main quality indicator.
- Key events are the events you mark as important, such as a form submission or a purchase. They were previously called conversions in the interface.
- Channel groups sort traffic into categories such as Organic Search, Paid Search, Direct, Referral, Email and Organic Social.
Google explains the structure of the menus in its overview of Analytics reports, and the full list of fields in the dimensions and metrics reference.
The Five Reports Worth Checking Every Week
These reports give a rounded picture without overwhelming you. Menu names can change slightly over time, but the content stays similar.
1. Reports snapshot or Home
The home page and reports snapshot show users, new users, key events and revenue for the selected period, plus a trend line and a few cards. Use them as a quick health check. A sudden fall in users, a flat key event line after a site change or a spike from an unknown country is a prompt to dig deeper.
2. Traffic acquisition
Found under Acquisition, this report shows sessions by channel group and by source and medium. It tells you which channels send visitors and how well those visitors engage.
- Compare sessions, engagement rate and key events per channel, not sessions alone. A channel with large volume and low engagement may not be worth more effort.
- Check that paid campaigns appear under the expected channel. If paid clicks show up as Direct or Referral, your campaign links may lack tags. Our guide to UTM parameters for auto-posted social traffic shows how to tag links consistently.
- Watch Organic Search week by week. Combined with Search Console, it shows whether your SEO work is reaching people.
3. Pages and screens
In the Engagement section, this report lists pages by views, users and average engagement time. It answers which pages attract attention and which ones do not.
- Sort by views to see your top content, and compare with the previous period.
- Look for important pages with low engagement time. They may be confusing, slow or mismatched with what visitors expected.
- Check that your service, pricing and contact pages are visited as much as you expect. If not, improve internal links and navigation.
4. Key events
This report lists each event marked as a key event with its count and value. Review it every week to confirm that forms, calls, downloads, bookings or purchases are still being recorded and that the numbers are plausible. A key event that drops to zero overnight usually means a broken tag or form, not a sudden loss of interest.
5. Tech details or Demographics, used selectively
Look at device category (mobile, desktop, tablet), browser and screen resolution when you suspect a usability problem. If most visitors use phones but conversion is much lower on mobile, you have a clear priority. Demographic and location reports are useful for local businesses and for confirming that you are reaching the right regions.
A 20-Minute Weekly Routine
- Set the date range. Compare the last 7 days with the previous 7 days, or the last 28 days with the previous period for smaller sites.
- Read the snapshot. Note the change in users and key events. Write down anything above roughly 20 percent that you cannot explain.
- Open Traffic acquisition. Add the key events column. Identify the best and the worst channel by key events and engagement rate.
- Open Pages and screens. List the five top pages and the three pages you most want people to see. Check the trend.
- Open Key events. Verify counts against another source, such as emails received, orders in the shop or calls logged.
- Check Realtime once. Open the site yourself and confirm that you appear, which shows that tracking is alive.
- Write one decision. Choose a single action for the coming week, such as fixing a landing page, adjusting a campaign or publishing an article for a growing topic.
The final step matters most. Analytics only pays off when a report leads to a change.
Which Report Answers Which Question
| Question | Report to open | Key figures | What to do with it |
|---|---|---|---|
| Is traffic growing or falling? | Reports snapshot, Traffic acquisition | Users, sessions, change versus previous period | Investigate large moves in a single channel |
| Which channels bring useful visitors? | Traffic acquisition | Engagement rate, key events per channel | Shift effort toward the channels that convert |
| Which content works? | Pages and screens | Views, engagement time, key events by page | Update and promote what works, fix what does not |
| Are leads and sales being recorded? | Key events | Event count and value | Test forms and checkout if counts drop |
| Are phones a problem? | Tech details | Engagement and key events by device | Test and improve the mobile experience |
| Did a campaign pay off? | Traffic acquisition with campaign dimension | Sessions, key events, cost from ad platform | Compare against the cost shown in your ad account |
Set Up the Basics Before You Trust the Reports
Reports are only as good as the configuration behind them. Spend an hour on the following items once, and your weekly reviews become far more reliable.
- Confirm the data stream. Check that the measurement ID on the site matches the stream in your property, and that the tag loads on every page, including checkout and thank-you pages.
- Mark the right key events. Choose the two to five events that represent business value, such as a contact form submission, a click on a phone number, a booking or a completed purchase. Remove the key event status from events that are only signs of activity.
- Exclude internal traffic. Define your office addresses and apply the internal traffic filter, so staff visits do not inflate small numbers.
- Set the data retention period. The default for event data in some properties is short. Extend it to the longest option available if you want to analyze older data in explorations.
- Link Search Console and Google Ads. This adds query and cost data next to behavior data.
- Check cross-domain and payment redirects. If checkout happens on another domain, configure it so that a purchase is not counted as a new visit from a referral.
- Review who has access. Give edit rights only to those who need them and remove former staff and agencies.
Reading a Simple Example
Imagine a small furniture shop. In the weekly review, the snapshot shows users up 12 percent but key events flat. Traffic acquisition reveals that Organic Search is stable, while a new Organic Social source has added many sessions with a very low engagement rate. Pages and screens shows that these visitors land on a blog post with no link to any product. The Key events report confirms that purchases from search visitors are unchanged.
The conclusion is not that social media failed. The visitors came for the article and had no clear next step. The decision for the week is to add links to related collections in that post and a short note about delivery times, then check the same figures next week. This small chain of observation, explanation and action is what a weekly GA4 review is for. The numbers rarely give the answer by themselves; they tell you where to look, and your knowledge of the business explains why.
Combine GA4 With Search Console and Your Ad Accounts
GA4 shows what visitors do after they arrive. It does not show the searches that produced impressions, how your rankings changed or how much you spent. Link it with other sources to see the whole story.
- Search Console shows queries, impressions, click-through rate and position. Our guide to finding quick wins in Google Search Console explains how to use it next to analytics.
- Google Ads data, once linked, adds cost, clicks and campaign names, so you can compare spend with key events. See our Google Ads service page for how we approach reporting.
- Your own records, such as the number of enquiries in the inbox or orders in the shop, provide a reality check. If GA4 shows far fewer or far more than your records, something is wrong with tracking.
Common Mistakes That Distort the Data
- Counting everything as a key event. If scrolls and clicks are all marked as key events, the number loses meaning. Mark only actions that matter to the business.
- Not filtering internal traffic. Visits from your own team inflate numbers on a small site. Define and exclude internal traffic.
- Ignoring consent. In regions with consent requirements, declined cookies reduce measured traffic. Treat GA4 as a sample, not an exact count, and look at trends.
- Comparing different periods unfairly. Compare full weeks, and be aware of holidays, campaigns and seasonality.
- Reading data too early. Recent days may still be processing. Standard reports can lag, so avoid conclusions from the last day or two.
- Chasing small changes. On a low-traffic site, a swing of a few visits is noise. Wait for patterns across several weeks.
- Different tools, different numbers. GA4, your ad platform and your shop will not match exactly because they count differently. Use each for its strength and look for consistent direction.
If you would like help setting up reports, dashboards and a review rhythm that fits your business, you can contact us.
Frequently Asked Questions
Which GA4 reports should a small business check first?
Start with the reports snapshot, Traffic acquisition, Pages and screens and Key events. Together they show how many people visit, where they come from, what they view and whether they take the actions that matter to you.
What happened to bounce rate in GA4?
GA4 uses engagement rate, the share of sessions that were engaged. Bounce rate still exists as the opposite of engagement rate in some reports, but engagement rate is the main indicator of visit quality.
What is the difference between users and sessions?
A user is a person or device. A session is one visit. If someone visits your site three times in a week, that is one user and three sessions.
Why do GA4 numbers differ from my ad platform or shop?
Tools define and attribute clicks, visits and conversions differently, and consent settings, ad blockers and processing delays reduce what GA4 sees. Expect differences and focus on trends and consistency.
How often should I look at analytics?
A short weekly review is enough for most small businesses, plus a monthly look at trends. Checking daily rarely helps, unless you are running a campaign or have just changed the site.
Do I need custom reports?
Not at the start. The standard reports answer most basic questions. Explorations and custom reports are useful later, for example to view landing pages together with key events, but they add complexity.
The Bottom Line
You do not need to master every Google Analytics 4 report to make better decisions. Learn the basic vocabulary of users, sessions, engagement and key events, then check the snapshot, Traffic acquisition, Pages and screens and Key events each week, with a quick look at device data when something seems off. Compare periods fairly, cross-check against Search Console, your ad accounts and your own records, and finish every review with one action. A twenty-minute habit like that will tell you more about your website than hours of random clicking.