

 English
 Lietuvių
 Latviešu
 Eesti
 Русский
 Polski
 Українська
 Deutsch
 Italiano
 Español
 Français
 Português
 Čeština
 Magyar
 Română
 Ελληνικά
 Türkçe
 日本語
 العربية
 हिन्दी
 Bahasa Indonesia
 Bahasa Melayu
 ไทย
 Tiếng Việt
 বাংলা
Marketing Attribution Models: First-Click, Last-Click and Data-Driven
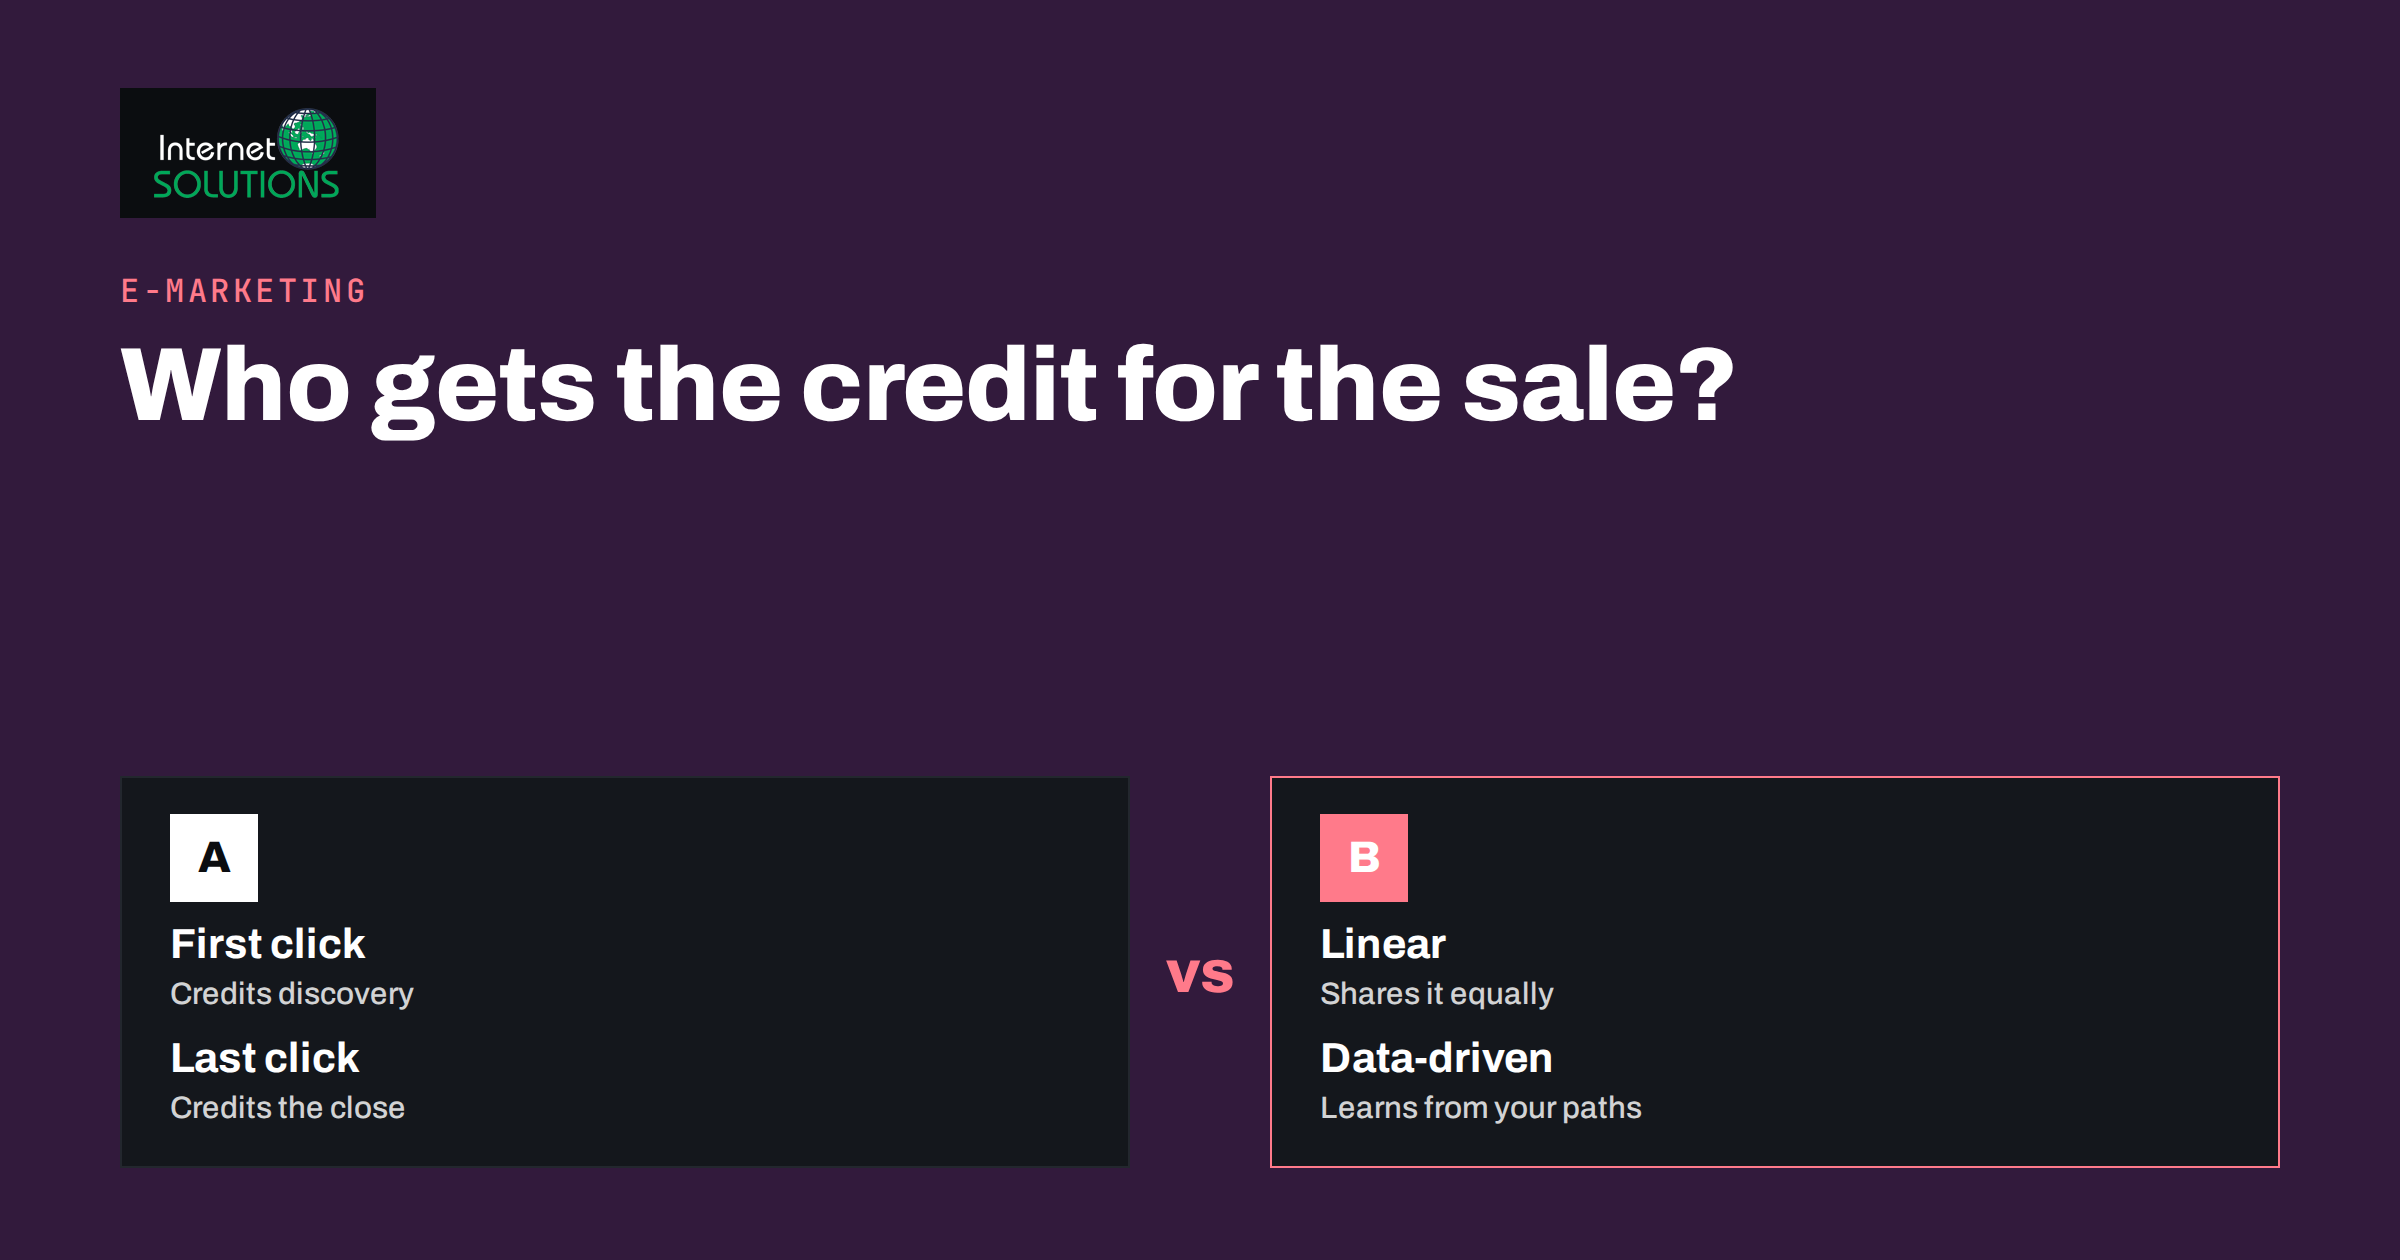
Marketing attribution models answer a deceptively simple question: when a customer buys, which marketing activity gets the credit? A shopper may first see a social post, later click a search ad, read your blog, open an email and finally type your address directly into the browser before buying. Each of those touchpoints helped. An attribution model is the rule that divides the value of the sale among them, and the rule you choose changes which channels look good and which look useless. That is why the same budget can look brilliant in one report and wasteful in another.
This guide explains the main attribution models in plain language, shows how they differ with a worked example, describes what current analytics tools actually offer and gives practical advice on choosing one, avoiding common misreadings and using attribution to make better budget decisions. It is written for owners and marketers of small and medium-sized businesses, not for data scientists, and it keeps the arithmetic simple.
Why Attribution Matters for Budgets
Every marketing report is built on an attribution decision, even when nobody made it consciously. If your report shows conversions by the last channel the customer used, it gives all the credit to the final step. Channels that introduce customers to your business, such as content, social media, video or display ads, will look weak, and channels that close the sale, such as branded search, email and direct visits, will look strong. A manager reading the report may cut the first group and then wonder why the second group dries up.
The reverse is also possible. A model that rewards the first touch flatters awareness activities and ignores the work done by the channels that persuade people to finish the purchase. No model is neutral, and none reveals the exact truth about why a person bought. The right goal is not a perfect model but a consistent and understood one, combined with common sense and testing.
- Budget decisions: which channels get more or less money.
- Agency and team evaluation: who is judged to have delivered results.
- Content strategy: whether articles, videos and social posts are valued for the early role they play.
- Forecasting: what would happen if one channel were switched off.
The Main Attribution Models
Attribution models fall into two families. Rule-based models follow a fixed formula. Data-driven models use statistics on real conversion paths to estimate how much each touchpoint contributed. The common ones are described here.
- Last click: all the credit goes to the final interaction before the conversion. It is simple and widely used but ignores everything that led the person there.
- First click: all the credit goes to the first interaction. It values discovery but ignores what convinced the customer.
- Linear: credit is split equally across all touchpoints. It acknowledges the whole journey but treats a casual impression the same as a decisive visit.
- Time decay: touchpoints closer to the conversion receive more credit than earlier ones. It suits short sales cycles and promotions.
- Position-based: the first and last interactions get the largest shares, often forty percent each, and the middle ones share the remainder.
- Data-driven: a statistical model assigns credit based on how conversion paths with and without a given touchpoint compare. It adapts to your own data but needs enough conversions to work well and is harder to explain.
A Worked Example
Imagine a customer who buys a product worth 100 euros after four interactions: they click a social post, then a search ad, then read an email and finally visit the site directly. The table shows how each model splits the 100 euros. The figures for position-based and time decay are illustrations of the typical approach; real tools may weight steps differently.
| Model | Social post | Search ad | Direct visit | |
|---|---|---|---|---|
| Last click | 0 | 0 | 0 | 100 |
| First click | 100 | 0 | 0 | 0 |
| Linear | 25 | 25 | 25 | 25 |
| Time decay (example) | 10 | 20 | 30 | 40 |
| Position-based (40/20/20/20 example) | 40 | 10 | 10 | 40 |
The same sale makes social media look worth everything, nothing or something in between. This is why it is dangerous to compare channels using reports built on different models, or to compare one platform’s numbers with another’s without knowing which model each uses.
What Your Tools Actually Use
Most small businesses meet attribution inside a few tools, each with its own defaults. Understanding them avoids confusion when numbers do not match.
- Google Analytics 4 uses data-driven attribution by default for key events and offers alternatives based on last click. Google has removed several of the older rule-based models from this tool. The details are in its help article on attribution and attribution modeling, and the available models and lookback windows can be seen under the admin settings.
- Google Ads reports conversions according to the attribution model chosen for each conversion action, with data-driven attribution as the standard recommendation where eligible. Its documentation on attribution models describes the options and how a change affects bidding.
- Meta Ads reports using attribution windows that count conversions after a click or a view within a chosen period. See our guide to Facebook Ads attribution and reporting for how those windows work.
- Email and CRM platforms often credit a sale to an email if the customer clicked or even opened it within a number of days, which can inflate their numbers.
- Your own shop or CRM may record only the first or last source stored in a cookie or form field, which is a form of first-click or last-click attribution.
Because every platform attributes in its own favour and from its own vantage point, totals reported by all of them usually exceed the actual number of sales. Treat each report as a view of that platform’s contribution, not as an independent audit. Your own revenue records are the ground truth.
Choosing a Model for Your Business
Choose according to your sales cycle, your channels and your decision. There is no universal answer, but these guidelines help.
- Short cycle, few channels: a last-click or data-driven view is usually adequate. A local service business with mostly search and map traffic will not gain much from complex models.
- Long cycle, many touchpoints: a position-based or data-driven view, or reading several models side by side, gives a fairer picture of the roles of content and advertising. B2B sales and high-value purchases fall here.
- Brand building and new markets: look at first-touch data to see which channels bring new people in, alongside last-touch data for what closes them.
- Few conversions: data-driven models need volume. With only a handful of conversions a month, a simple model that you can explain is more useful than a statistical one that has little to learn from.
- Different questions, different models: use a first-touch lens to ask what finds customers and a last-touch lens to ask what closes them. The disagreement between the two is informative.
Whatever you choose, write it down and use it consistently in monthly reports. Changing models every few months makes trends meaningless. If you work with an agency, ask which model is used for each report and why. Our overview of e-marketing services includes help with measurement and reporting.
Data That Attribution Needs
An attribution model can only credit what it can see. Gaps in your data create blind spots that no model fixes.
- Consistent campaign tagging: use the same UTM parameters across email, social and partner links, so that sources are recognised and not lumped into direct traffic or “other”.
- Working conversion tracking: events must fire reliably, as described in our guide to conversion tracking that holds up.
- Offline outcomes: phone calls, visits and sales closed later in a CRM are invisible unless you import them. Read how to feed them back in our article on offline conversion import, and how to measure calls in call tracking for small businesses.
- Consent and privacy limits: visitors who decline tracking, blockers and browser restrictions mean that part of the journey is missing. Expect reported numbers to be a partial view.
- Cross-device journeys: a person who researches on a phone and buys on a laptop may appear as two visitors.
Common Misreadings
- Believing “direct” traffic is real direct traffic. A large share is untagged email, messaging apps, dark social and links from documents.
- Crediting branded search entirely to search ads. People who search for your brand were often persuaded elsewhere first.
- Cutting top-of-funnel channels because last-click numbers are low. The sales may fall weeks later, when the pipeline of new people runs dry.
- Adding the platform reports together. The total will exceed real sales because each platform claims shared credit.
- Treating a data-driven model as a truth machine. It is an estimate based on correlation in your data and depends on tracking quality.
- Ignoring the lookback window. A long window credits old touches; a short one drops them. Compare reports only when the windows match.
Beyond Attribution: Tests and Common Sense
Attribution describes paths; it does not prove cause. Two approaches improve confidence. The first is experimentation: pause a channel in one region or for a limited time, or run an ad campaign only in selected areas, and watch total sales rather than channel-reported sales. The second is simple surveys: ask new customers on the order form or in the first conversation how they heard about you. The answers often reveal channels that tracking never records, such as recommendations or events.
Use these methods to calibrate the model. If your analytics says that social media brings almost nothing but customers keep telling you they found you there, treat the analytics view as incomplete. If paid search seems to bring half of sales but pausing it changes little, you may be paying for customers who would have come anyway.
A Monthly Attribution Habit
- Choose the model and lookback window for your standard report and note them in the report footer.
- Compare first-touch and last-touch views for the main channels once a month and write down the biggest differences.
- Reconcile reported conversions with real orders or enquiries from your own records.
- Review untagged or “direct” traffic and fix tagging where possible.
- Record any budget changes, so that later reports can be read with context.
- Once a quarter, run one small test or ask customers how they found you, and compare it with the reports.
Frequently Asked Questions
What is the best attribution model?
There is no best one for every business. Data-driven models suit accounts with enough conversions, while simple last-click or position-based models are easier to explain and suit smaller volumes. Consistency matters more than the choice.
Why do Google Analytics and Google Ads show different conversions?
They count differently. They may use different attribution models, lookback windows, counting methods and dates, and Ads credits only its own clicks while Analytics sees all channels. Differences are normal and should be understood, not forced to match.
Is last-click attribution wrong?
It is not wrong, just incomplete. It correctly shows what closed the sale and hides what started and nurtured the journey. It is a reasonable starting point if you read it with that limitation in mind.
How many conversions do I need for data-driven attribution?
The tools set their own thresholds, and they change. As a practical rule, the more conversions and the more varied the paths, the better the model learns. With very small volumes, rely on simpler models and your own judgement.
Why does direct traffic look so large?
Direct traffic includes visitors with no recorded source, such as people typing the address, bookmarks and many links from messaging apps, documents and untagged emails. Better tagging reduces it.
Can attribution replace testing?
No. Attribution reports show associations in tracked data. Controlled tests and customer feedback show what happens when something changes, and the two together give the most reliable guidance.
The Bottom Line
Attribution models are different ways to share credit for a sale, and each one shifts the apparent value of your channels. Know which model each report uses, keep tagging and conversion tracking clean, compare first-touch and last-touch views and check the results against real sales and customer answers. Use attribution to ask better questions about your budget, not to settle arguments, and you will spend on what actually builds your business.