

 English
 Lietuvių
 Latviešu
 Eesti
Eesti Русский
 Polski
 Українська
 Deutsch
 Italiano
 Español
 Français
 Português
 Čeština
 Magyar
 Română
 Ελληνικά
 Türkçe
 日本語
日本語 العربية
 हिन्दी
 Bahasa Indonesia
 Bahasa Melayu
 ไทย
ไทย Tiếng Việt
 বাংলা
বাংলাGoogle Ads Quality Score: What It Measures and How to Improve It
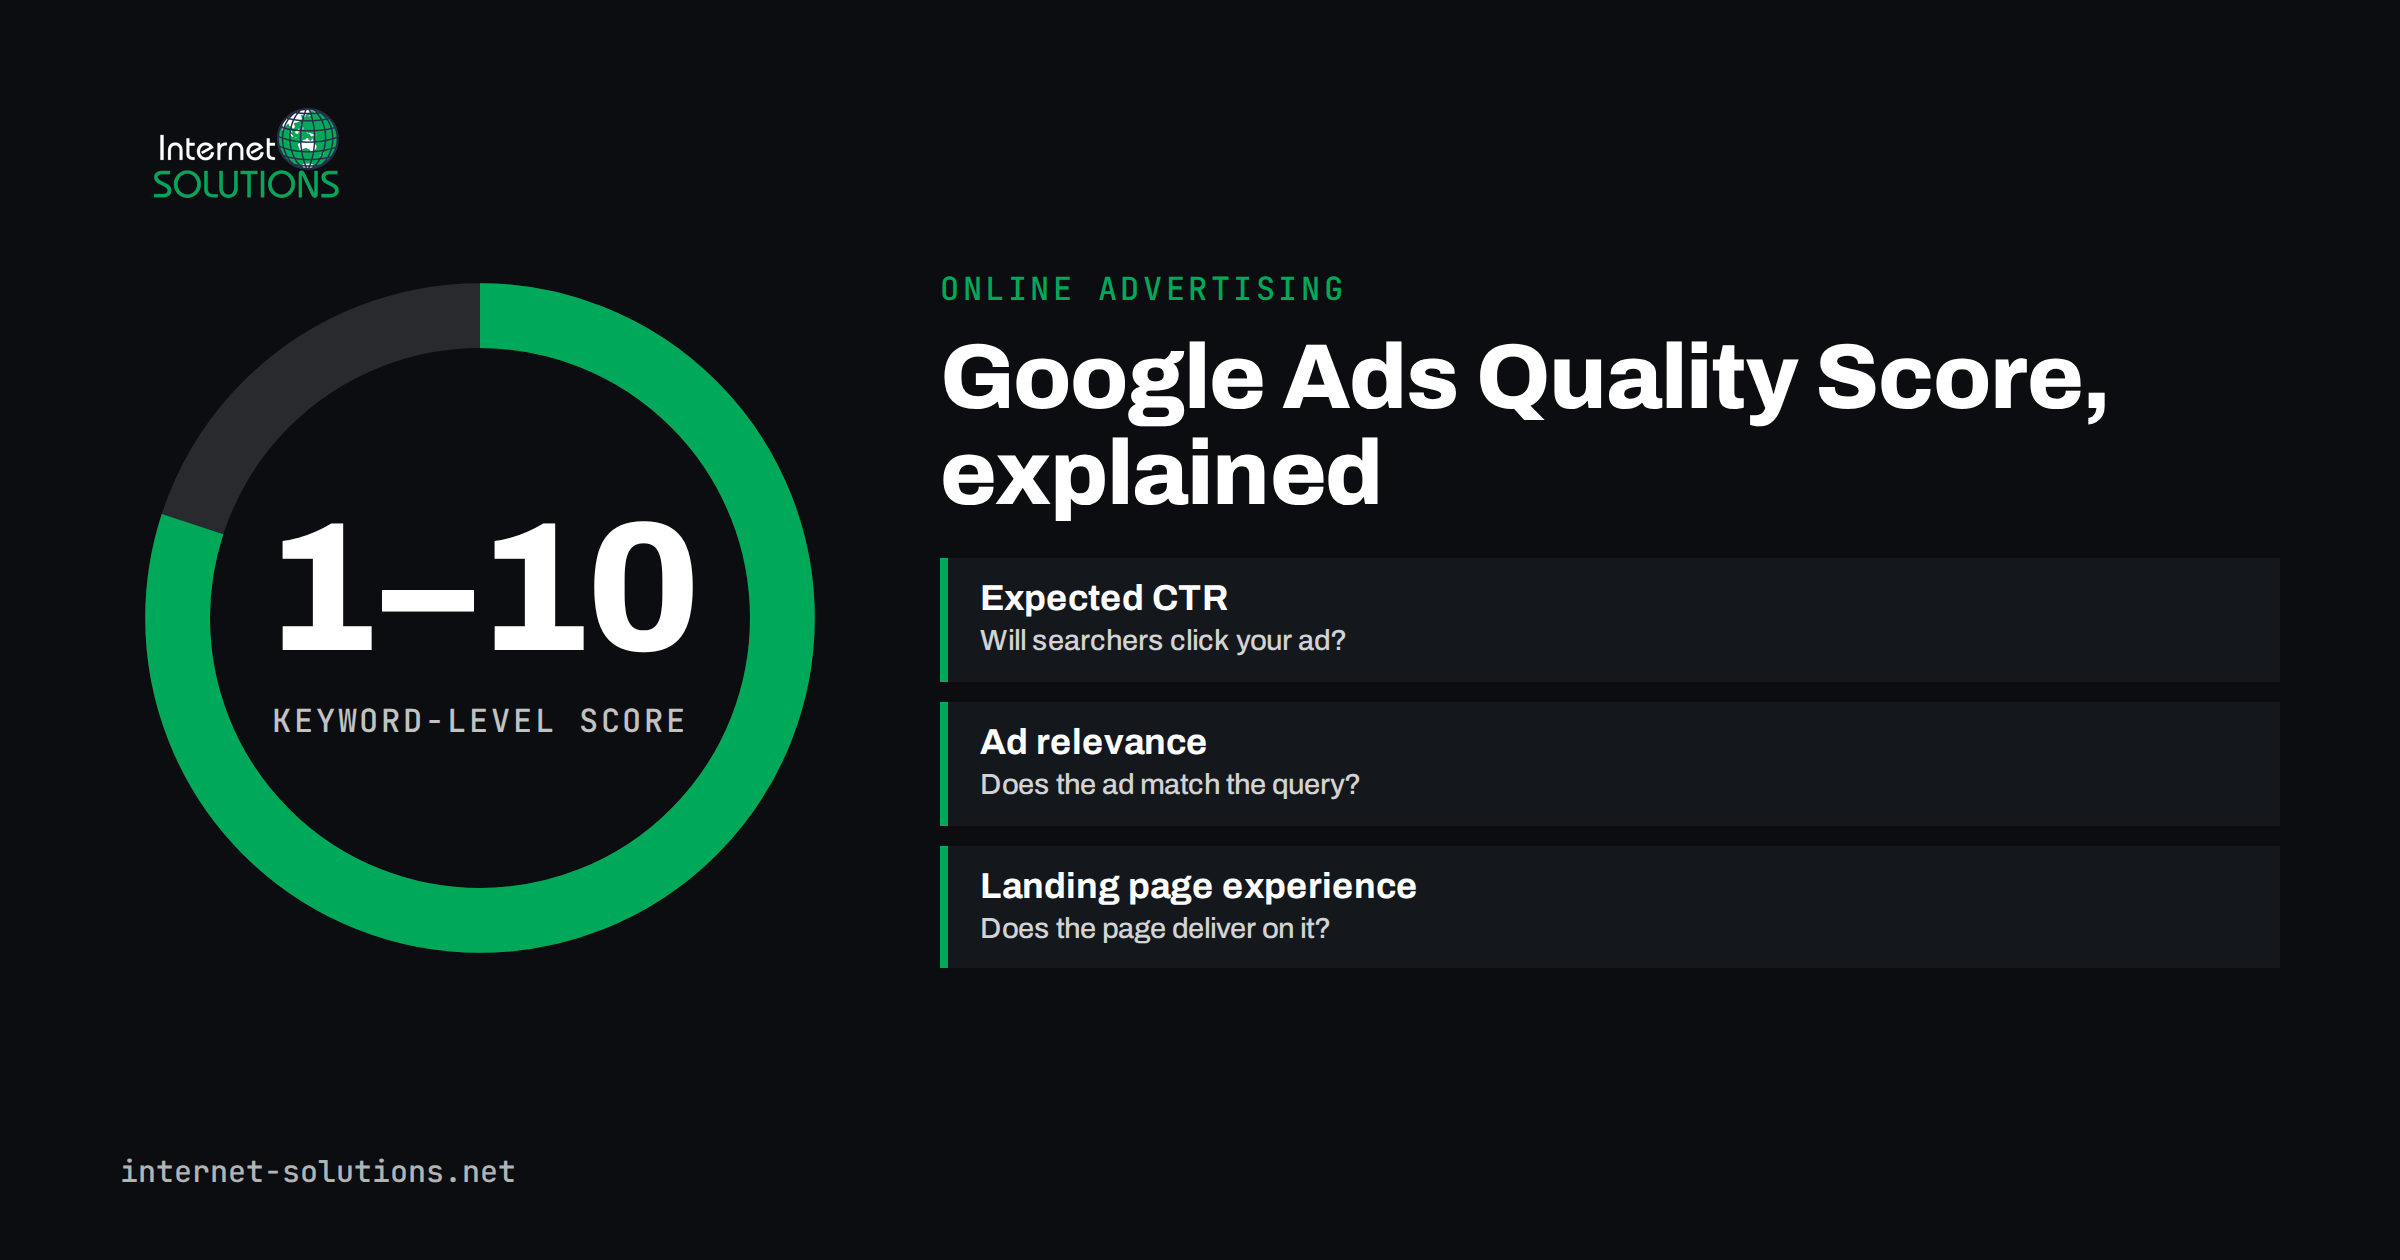
Google Ads Quality Score is the number most advertisers look at and fewest understand. It sits in a column next to each keyword, it runs from 1 to 10, and it seems to explain why one campaign pays twice as much per click as another. Some teams chase it as if it were the goal. Others ignore it completely. Both approaches waste money.
This guide explains what Google Ads Quality Score actually measures, what it does not measure, how it relates to the price you pay for a click, and which fixes are worth your time. The aim is practical: by the end you should be able to open an account, sort the keywords by spend, and know which low scores matter and what to do about them.
What Quality Score Is and Where You Find It
Quality Score is a diagnostic rating that Google assigns to keywords in Search campaigns. It estimates how relevant and useful your ads and landing pages are to people searching for that keyword, compared with other advertisers bidding on the same term. Google describes it in its help article About Quality Score for Search campaigns as a tool to help you understand how your ad quality compares with other advertisers.
You will find it in the Keywords view of any Search campaign. The column is often hidden by default, so add it through the column selector, together with the three component columns and, ideally, the historical versions of each. A keyword with too little traffic shows a dash instead of a number. That is normal for new or low-volume terms and says nothing bad about them.
A diagnostic, not an auction input
This is the point that clears up most confusion. The 1 to 10 number you see is not directly fed into each auction. At auction time Google calculates quality in real time, using the actual search, the device, the location, the time and many other signals. The Quality Score column is a summary of how your keyword has performed on average across many such auctions. Think of it as a warning light on a dashboard: useful for spotting a problem, but not the engine itself.
That distinction matters because it tells you how to use the score. You improve the things the warning light is pointing at, and the real-time quality signals improve with them. You do not try to move the number for its own sake.
The Three Components of Quality Score
Every Quality Score is built from three component ratings. Each one is shown as Above average, Average or Below average, and each one points to a different kind of fix.
Expected click-through rate
Expected CTR estimates how likely your ad is to be clicked when it shows for this keyword, adjusted for factors such as ad position and extensions. It is a prediction based on history, not your raw CTR. A Below average rating usually means the ad does not speak to what the searcher wanted, the offer is weaker than competitors’ offers, or the keyword triggers the ad for searches that were never going to click.
Ad relevance
Ad relevance measures how closely the ad matches the intent behind the keyword. When one ad group contains thirty loosely related keywords and two generic ads, relevance suffers because the ad cannot match all of them. Below average ad relevance is usually a structure problem more than a copywriting problem.
Landing page experience
Landing page experience estimates how relevant and useful the page is to people who click the ad. Google looks at whether the page delivers what the ad promised, whether it is easy to use on mobile, how quickly it loads and whether it is transparent about the business. Of the three components, this one is most often ignored by advertisers and most often decisive for conversions, which is why it deserves attention even when the score looks acceptable.
How Quality Score Relates to What You Pay
Your position and cost are decided by Ad Rank, which Google explains in About Ad Rank. Ad Rank combines your bid, the quality of your ads and landing page at auction time, the minimum thresholds for showing an ad, the competition in that auction, the context of the search, and the expected impact of your assets such as sitelinks and callouts.
The practical consequence is simple: better quality lets you reach the same position with a lower bid, or a better position with the same bid. Two advertisers bidding the same amount can pay very different prices per click and appear in different positions because their ads and pages are not equally relevant. Quality also affects whether your ad is eligible to show at all in the top positions, since those have higher thresholds.
Why a 10 is not the target
Quality Score is relative. A 7 on a highly competitive commercial keyword may be excellent, while a 7 on your own brand name is a sign of trouble. More importantly, the account does not earn money from Quality Score. It earns money from conversions at an acceptable cost. A keyword with a 5 that converts profitably is more valuable than a keyword with a 9 that brings curious visitors who never buy. Use the score to find waste and friction, then judge every change by conversions and cost per acquisition.
Reading Quality Score Data Without Fooling Yourself
Before changing anything, look at the data in a way that shows where the money is.
- Sort by cost, not by score. A 3 on a keyword that spent almost nothing last quarter is not a priority. A 5 on the keyword that takes a third of your budget is.
- Look at the components, not the total. The total tells you there is a problem. The component tells you which team should fix it: the account structure, the ad copy or the website.
- Check the historical columns. Historical Quality Score shows the last known value for a date range. If a score dropped after a site redesign or a new landing page, the timeline tells you why.
- Weight by impressions. For account-level reporting, calculate an impression-weighted average instead of a simple average, so a handful of rarely shown keywords do not distort the picture.
- Ignore dashes. Keywords without enough data show no score. Do not pause them because of that.
Common Causes of a Low Score and How to Fix Them
The table below maps each weak component to its usual causes and the fixes that tend to work. Start with the row that matches the component rated Below average on your highest-spending keywords.
| Component rated Below average | Typical cause | Fix that usually works | Who owns the fix |
|---|---|---|---|
| Expected CTR | Generic ad text, weak offer, broad keywords matching irrelevant searches | Put the searcher’s words and a concrete benefit in the headline; add negative keywords; use sitelinks and callouts | Ad copy and keyword management |
| Ad relevance | Too many unrelated keywords in one ad group | Split ad groups by intent so each ad can match its keywords closely | Account structure |
| Landing page experience | Traffic sent to the homepage, slow mobile page, offer missing from the page | Send each ad group to the most specific page; fix speed; repeat the ad’s promise above the fold | Website and development |
| All three | The keyword does not fit the business | Pause it or move it to a tightly controlled test ad group | Strategy |
| Brand keyword with low score | Tracking or landing page problem, or competitors bidding with better ads | Check the destination URL, page speed and ad text; use the brand name in the headline | Account and website |
Improving Expected Click-Through Rate
A higher expected CTR comes from showing the right ad to the right search and making it the obvious choice on the results page.
Match the searcher’s words and intent
People scan search results quickly. When the headline repeats the idea they typed, the ad feels like an answer instead of an interruption. For a keyword like “emergency plumber open now”, a headline about availability tonight will outperform a headline about fifteen years of experience, even though both are true.
Filter out searches that will never click
Broad and phrase match keywords can trigger ads for searches that look related but are not. The search terms report shows what people actually typed. Adding negative keywords for irrelevant searches removes impressions that lower your CTR and waste money. If match types and negatives are unfamiliar, our guide to Google Ads keyword match types and negative keywords walks through them in detail.
Use every relevant asset
Sitelinks, callouts, structured snippets and call assets make the ad larger and more informative. They also count towards the expected impact of assets in Ad Rank. Add assets that answer real questions, such as prices from, delivery times or opening hours, rather than filler.
Write several headlines that are genuinely different
Responsive search ads combine headlines and descriptions automatically. If all fifteen headlines say the same thing in slightly different words, the system has nothing useful to test. Give it distinct angles: price, speed, trust, specific features and a clear call to action.
Improving Ad Relevance
Ad relevance is mostly fixed by structure. The rule of thumb is that every keyword in an ad group should be satisfied by the same ad without stretching.
- Group by intent, not by topic. “Buy running shoes” and “how to choose running shoes” share words but not intent. They belong in different ad groups, and possibly the second does not belong in the account at all.
- Keep ad groups small enough to be specific. There is no magic number, but when you cannot write a headline that fits all keywords in a group, the group is too broad.
- Use the keyword’s language in headlines. Not keyword stuffing, just the same terms the searcher used, placed where they are seen first.
- Review search terms after restructuring. Splitting ad groups sometimes changes which keyword and ad a search is matched to. Check that each search lands in the group you intended.
Improving Landing Page Experience
This is where advertising and website work meet, and it is often the component with the biggest effect on profit. A better page improves Quality Score, but it also improves conversion rate, which lowers the cost of every sale regardless of the score.
Send each ad group to the most specific page
The homepage is rarely the right destination. Someone searching for a specific service or product should arrive on a page about exactly that. If the right page does not exist, building it is usually cheaper than paying for clicks that bounce.
Keep the promise of the ad
If the ad says free delivery over a certain amount, the page must show it. If the ad mentions a price, the page must show the same price. Mismatches destroy trust instantly and are one of the most common reasons for a Below average landing page rating.
Fix mobile speed and usability
Most search clicks now come from phones. A page that takes several seconds to show content, shifts while loading or hides the contact form behind pop-ups loses visitors before they read anything. Our checklist of landing page fixes for paid traffic covers speed, forms and trust signals step by step.
Be transparent
Show who you are, how to contact you, and what happens after someone submits a form or places an order. Clear business information, a privacy policy and honest terms are part of what Google calls a useful page, and they are also what visitors look for before they spend money.
A Practical Monthly Routine
Quality work is not a one-off project. A simple monthly routine keeps scores healthy without taking over your week.
- Export keywords with cost, conversions, Quality Score and the three components for the last 30 days.
- Filter to the keywords that make up about 80 percent of spend.
- Flag any of them with a Below average component, and any whose historical score dropped.
- Assign each flag to structure, copy or website, using the table above.
- Make one change per ad group at a time, and note the date, so you can see its effect in the historical columns.
- Review the search terms report and add negatives.
- After four to six weeks, compare cost per conversion before and after, not just the score.
If you manage several accounts or lack the time to run this routine, it is the kind of ongoing work our Google Ads management service covers, alongside bidding, tracking and reporting.
Mistakes That Waste Time
- Pausing every keyword under 5. Some low-scoring keywords convert well. Judge them on results.
- Creating single-keyword ad groups for everything. Extreme fragmentation makes accounts hard to manage and starves automated bidding of data. Group by intent instead.
- Rewriting ads every week. Ads need impressions to show what works. Constant changes reset the learning.
- Blaming Google for a landing page problem. If the landing page component is Below average, no bid strategy will fix it.
- Chasing the number on brand terms only. Brand keywords usually score high anyway. The money is in the non-brand terms.
Frequently Asked Questions
What is a good Google Ads Quality Score?
Scores of 7 or higher usually indicate that ads and landing pages are competitive for that keyword. Treat the score as relative: a 6 on a very competitive term can be fine, while a low score on your own brand name needs attention.
Does Quality Score directly set my cost per click?
No. The 1 to 10 number is a diagnostic summary. Auctions use real-time quality signals as part of Ad Rank, together with your bid and other factors, and better quality generally lets you pay less for the same position.
Why does my keyword show a dash instead of a score?
A dash means there is not enough recent search data for that exact keyword. It is common for new or low-volume keywords and does not mean the keyword is performing badly.
How long does it take for Quality Score to change?
Components update as new impressions and clicks come in. On busy keywords you may see movement within a couple of weeks; on low-volume keywords it can take much longer. Use the historical columns to track change over time.
Does Quality Score exist for Performance Max or Display campaigns?
The Quality Score column is reported for keywords in Search campaigns. Other campaign types use quality signals in their auctions too, but they do not show this 1 to 10 keyword rating.
Which component should I fix first?
Start with the component rated Below average on your highest-spending keywords. Landing page experience often has the biggest effect on profit, because improving the page also raises the conversion rate.
The Bottom Line
Google Ads Quality Score is a useful warning light, not a goal. It tells you, keyword by keyword, whether searchers are likely to click, whether your ads match their intent and whether your landing pages deliver. Fix what it points to, starting with the keywords that spend the most, and assign each fix to the right owner: structure, copy or website. Then measure success the way the business does, by cost per conversion and revenue, and let a better score be the side effect of a better account.